Scale operations, not headcount


Trusted by operations teams in every industry


Get started with templates
Spend less time searching for issues and more time solving


Product Video
Never make the same mistake twice

Feature Details
Operational systems are composed of three parts

How Avenue Works
Unlock operational excellence

Connect to anything
Avenue connects to your data whether it's in Google Sheets or Postgres. No more dashboard sweeps or constantly staring at color-changing Google Sheets. Let Avenue take on the work of monitoring for you and alert the right people at the right time.
Built for operators
Simple drag-and-drop playbook builder, create alerts from visual editor, or get started with our Operational AI Copilot ✨


No more context-switching
Meet your teams where they are and build the coordination layer for your company. Avenue can easily create and sync alerts across any tool. Sync your Slack threads and Linear comments to keep your Ops and Eng type seamlessly connected. No more context switching, sync messages everywhere.
What people are saying
Operators love Avenue

Mark De Paola
Head of CX, Slash
Avenue is literally insane. The most impressed I've been with a platform ever.

Adam Stansell
Co-Founder & CEO, Axle Health
The ability for alerts to be auto-resolved is massive because we have a lot of situations where we want to know if a thing has happened, but we also want to know if it requires immediate action or not. Avenue gives us a level of sophistication that we didn’t have before.

Alejandro Lozano
COO, Vitau
We don’t have to search for operations issues anymore. Avenue surfaces problems for us and ensures they get resolved.


Lorenzo Carlisle
BizOps Lead, Fair Square
Avenue is the backstop for our business.

Bowie Cheung
Co-Founder and CEO, Pepper
Avenue lets us easily monitor our increasingly complex system. From customer activity and order inaccuracy to fraud reviews and QA, Avenue keeps our team alert to what’s important, at all times.

John Eletto
Software Engineer, Stable
With Avenue, not only are we able to save around 4 hours a week by not constantly checking dashboards, but it’s inspiring us to continue finding new ways of monitoring our processes and improving our operations.


All-in-one tool for ops
Become operationally excellent
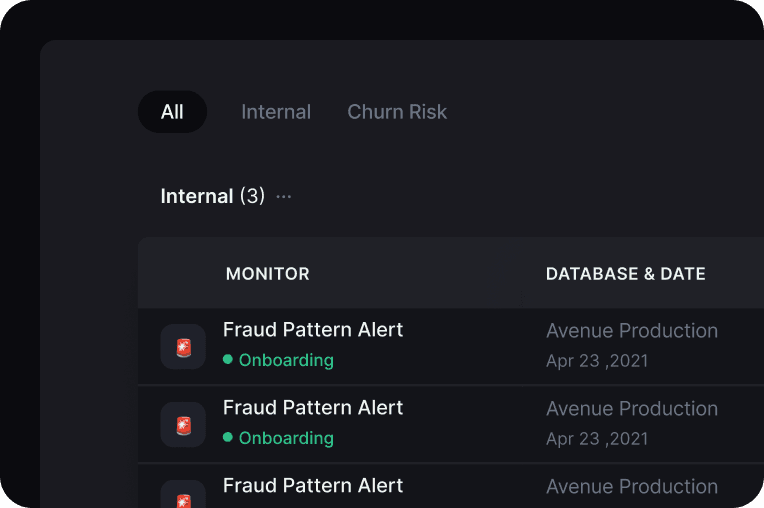
Alert everything
Stay ahead with real-time notifications on important KPIs, igniting prompt action

All your playbooks in one place
Power accountability and resolution with automated, context-driven action plans
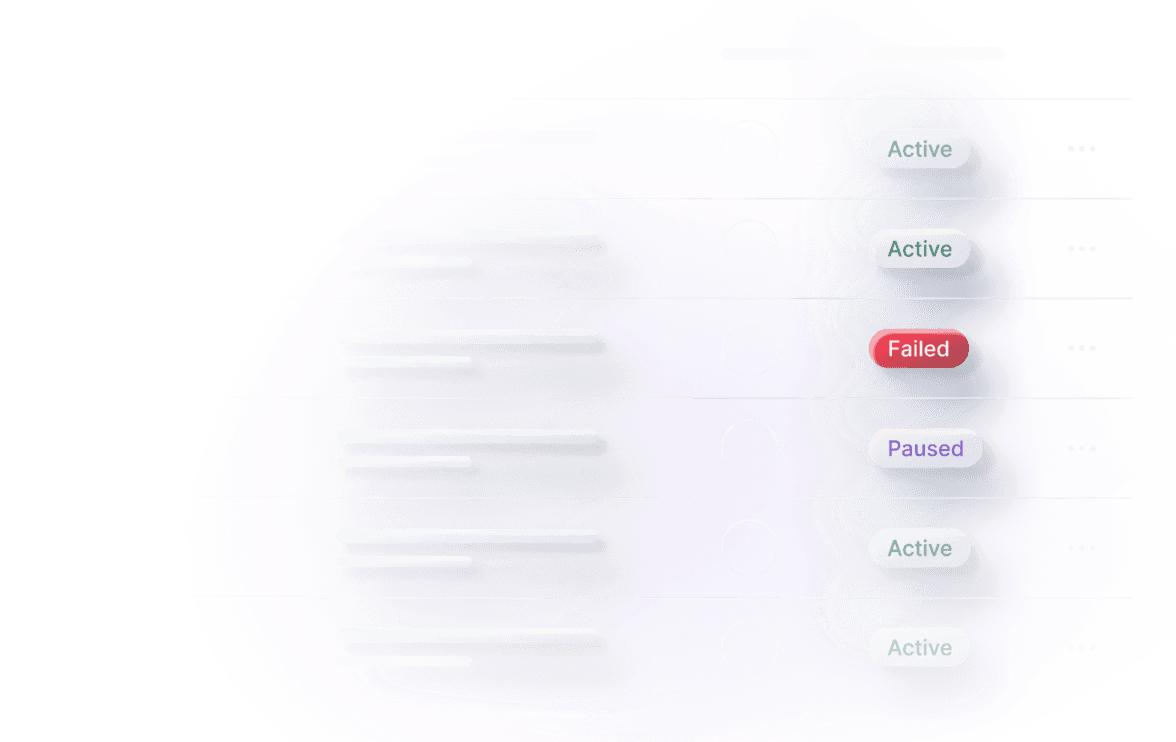
Quantify your Ops
Continually improve your ops: reduce volume, time to response, and more.

Meet your teams where they are
Sync messages and file uploads between Slack, Asana, Zendesk, Notion, and all our integrations

Organized calm
Dynamic tags and labels for everything to make search and retro as easy as pie